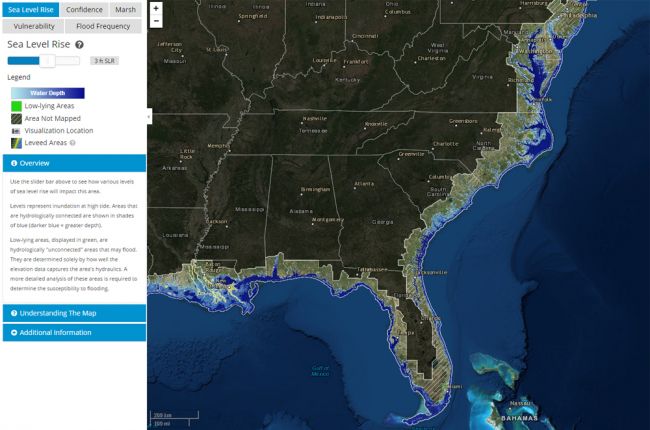
Interactive map of coastal flooding impacts from sea level rise
NOAA’s Sea Level Rise map viewer gives users a way to visualize community-level impacts from coastal flooding or sea-level rise (up to 10 feet above average high tides). Photo simulations of how future flooding might impact local landmarks are also provided, as well as data related to water depth, connectivity, flood frequency, socio-economic vulnerability, wetland loss and migration, and mapping confidence. The viewer shows areas along the contiguous United States coast, except for the Great Lakes.
Where do these maps come from?
The maps are produced using detailed elevation maps with local and regional tidal variability.
- Flood maps may be useful to some extent for flood risk assessment or in flood management, flood control, etc.
- Flood Map may help to provide flood alert/flood warning if the flood water level at a certain point is rising.
- Flood maps can help to locate places at higher levels to escape from floods or in flood rescue/flood relief operations.
- It can also provide a floodplain map and flood line map for streams and rivers.
- The effect of sea-level rise or sea-level change can be seen on the map. This could be helpful in coastal areas.
- Global Warming and Sea Level Rise are the effects of Climate Change
- It can help to perform elevation analysis of an area for any purpose like city/town planning, new construction, etc.
- We also think that it can help in planning irrigation systems and water management.
- By setting negative elevation, a Bathymetry study is also possible.
The elevation layered on the map is in meters and is from sea level. The elevation is zero for the sea level. Negative elevation means depth below sea level.
The article was originally published here.


Comments are closed.